Any good news organization knows how to use its brand and the media vehicles it owns and operates to both inform and influence. Â We’ve seen this up close on several occasions at the Guardian.
We’re learning how to inspire people through things that we don’t own and control now, too.
The great example is the Trafigura case.  Alan Rusbridger tipped the world via Twitter that there was a story we couldn’t tell, and the twitterverse came to our rescue, helping us to unveil the details we were prevented from sharing.

“Twitter’s detractors are used to sneering that nothing of value can be said in 140 characters. My 104 characters did just fine.
By the time I got home, after stopping off for a meal with friends, the Twittersphere had gone into meltdown. Twitterers had sleuthed down Farrelly’s question, published the relevant links and were now seriously on the case. By midday on Tuesday “Trafigura” was one of the most searched terms in Europe, helped along by re-tweets by Stephen Fry and his 830,000-odd followers.
Many tweeters were just registering support or outrage. Others were beavering away to see if they could find suppressed information on the far reaches of the web. One or two legal experts uncovered the Parliamentary Papers Act 1840, wondering if that would help? Common #hashtags were quickly developed, making the material easily discoverable.
By lunchtime – an hour before we were due in court – Trafigura threw in the towel. The textbook stuff – elaborate carrot, expensive stick – had been blown away by a newspaper together with the mass collaboration of total strangers on the web. Trafigura thought it was buying silence. A combination of old media – the Guardian – and new – Twitter – turned attempted obscurity into mass notoriety.”
The combination of our work and what other people do creates a very powerful bi-directional relationship.
However, there are different aspects to this relationship…the things that we work with (words, pictures, software, paper, etc.) and the ideas that we work with (stories, insights, opinion, facts, etc.).
The things are the ways we all express ourselves and transfer something from one person to the next, the tangible ouputs.
The ideas are the meat, the knowledge and intents that we all use to make decisions about our world.
We can then think about what we do as a business in terms of fueling a news media platform, a self-reinforcing ecosystem, a generative network where we use what we know to make things that people use and act on subsequently improving what we know…the cycle then continues and evolves.
Our operational model then falls into four areas:
- Things that we make.
- Things that people use.
- Ideas that people share.
- Ideas that we evaluate.
 Here are some things that we are doing now at the Guardian in each area.
MAKE
Most of our output falls into this category. Â We write articles, edit a newspaper, post to liveblogs on the web site, etc. Â We design and package things. Â We make apps.
Using the lens of mutualization we can also see some very progressive approaches to what we make.
One of the strengths of the Open Platform is our plugin architecture we call MicroApps. Â This allows us to work with independently operating services that can exist anywhere on the Internet and integrate them seamlessly into Guardian digital products.
We’ve used the MicroApp framework to work with partners such as WhatCouldICook.com who built a wonderful recipe search that now exists both on guardian.co.uk and on whatcouldicook.com.
We’ve also used the framework to develop some new sponsorship approaches.  We built a crowdsourced ‘interesting places’ app with the tourism service Visit England.  It runs both on guardian.co.uk and the EnjoyEngland web site.
 Success is easier to measure in this category than the others.  It’s mostly a cost center.
These are the kinds of results we would like to see:
- We make things quickly and cheaply
- The things we make perform well, have acceptable errors
- We make interesting, creative, groundbreaking things
- Our work is of a high standard, considered better than most competitors
- The amount of what we produce is sufficient for demand
We can also measure our success in terms of the work our partners are doing when we co-create.
USE
Every publisher has circulation and marketing teams that find ways to encourage use of the things we make. Â We want people to buy our newspaper and to visit our web site.
We also want to distribute our work through partners of various sorts. Â This is what the syndication business has been doing for years.
The production-consumption relationship can now benefit from the power of the network and ‘hypercharge’ syndication with things like APIs and RSS feeds, for example.
One of the most interesting examples of this in my mind is the Guardian WordPress plugin. Â Anyone who blogs can get a feed of Guardian articles pumped directly into their site, and they can then choose which articles they want to republish.
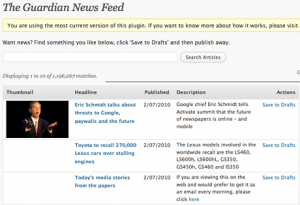 As Mike Smith said,
“If content is king, then this is service is a hundred of the king’s best horses, and thousands of his best messengers, sending the Guardian far and wide.”
We’ve also seen some incredible work by people using the data we’re publishing as part of the news cycle in the Data Store. Â There are hundreds of people posting images of ways they are using that data on a group on Flickr.
 Success in this category is easy to measure using some more traditional metrics and a few new ones.
Again, here are the kinds of results that would indicate success:
- People buy our paid-for products, and we make a profit on those products
- People see our free products, and we receive a high value subsidy for that
- People dive into our products and spend time with them
- Partners are using our stuff, and they are making money as a result
- Our partners offer successful paid and free things by using our stuff
- People buy access to our people, processes, platforms, partners
- Our market share in all the things we offer is strong
SHARE
It used to be that once our work made it into our customers’ hands we had very little idea what happened to it.
The Internet changed all that, too. Â People tell their media sources exactly what they think about what they produce. Â And they also tell all their friends in massively distributed public spaces.
What’s clear from examples like Trafigura, people want to share their thoughts. Â The tools to do so are getting better and better all the time, so why not fuel that activity?
Twitter has become a sort of extension of our brains, but we’re also creating very simple ways for people to share their thoughts and to socialize with the news. Â For example, during the TV debates for last year’s UK general election, we posted a ‘Reaction Tracker’ so that people could vote positively or negatively to things the politicians were saying them…as they were saying them on TV.
The lines you see in the chart below formed in realtime as the debate unfolded and were visible to everyone who visited the Guardian home page during the 90 minute debate.
 We’ve also embraced expert voices from around the world to participate with their contributions directly to the Guardian platforms. Â We have developed several blog networks in addition to Comment Is Free which has become a very rich conversation platform in its own right.
 Success in this area may feel a little more fuzzy, but there are some obvious metrics that social businesses tend to use.
These are the kinds of things that we would like to see happen:
- People both implicitly and explicitly indicate interests in things
- They spread our work through their social nets. Â Their social actions result in more actions from those connections.
- They participate in conversations we trigger and add to them with their ideas, both within and away from our products.
- They actively contribute by giving or selling us material to evaluate and then make things
- Things change in the world as a result of our work and the impact of our readers, users, and partners acting on it
EVALUATE
Research and investigation got much easier as the Internet increased the speed, access and volume of information available to all. Â Among the many things it did, the web made it easier to locate details and contacts.
These benefits also flattened the competitive field.
Not unlike the religious leaders who originally controlled the printing presses, many media organizations resisted acknowledging the value of the participants in new media doing similar work.
Rather than hide behind a thin veil of authority and broadcast knowledge, the best journalists mine the activity happening at the center of a story or an issue to improve their understanding of what’s going on wherever that activity is happening.
Of course, nothing beats a great contact at the heart of a story willing to share information exclusively, but capturing those signals at scale is getting easier as a result of the interconnectedness of the social web.
There are insights to be gleaned from social activity happening on Facebook and Twitter, expressed via Google Trends, and posted on blogs and photo sharing services everywhere.
We actually have our own firehose of news signals gushing out of our Apache referral logs.
Media businesses that embrace what’s happening across the network and even enable more useful activity to happen will be more effective in evaluating important information.
They will get a first look. Â They will have more inputs to choose from. Â They will be able to construct stronger outputs.
This happens when excellent investigative reporting surfaces important stories as David Leigh and Nick Davies have done with WikiLeaks.
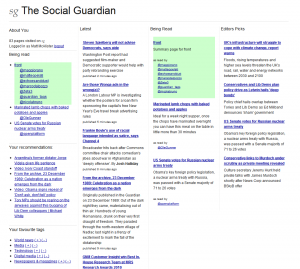
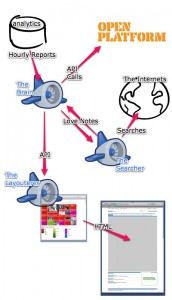
It can also happen systematically with things like Dan Catt’s Guardian Zeitgeist which captures activity signals from the web to present a different view of what Guardian articles people find interesting.
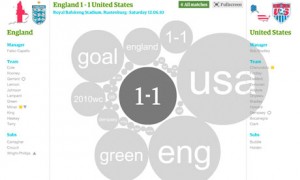
 Alastair Dant’s World Cup Twitter Replay animations are fascinating in the way they help you relive a match through the eyes of twitter…bubbles of words World Cup watchers were tweeting grow and shrink in response to each match, as if you are watching the match with everyone again rather than being the recipient of a leanback-style highlights package.
 Lastly, our data journalism work such as the recent government spending search tool demonstrates very clearly where the future of all of this is going.
With Simon Rogers leading the way, a small team of developers built a search interface to an otherwise completely unwieldy database. Â We published the tool and kicked off a liveblog to cover activity as it was happening throughout the day.
We received several emails from people digging through the data, including one user who discovered that the cost to the taxpayer of flying the British flag is nearly £100k.  It would’ve been hard for the person who found that data to get a response from the government as to why this is, but our reporter Polly Curtis was able to get a statement from the Department for Culture, Media and Sport, even if it was a bit unsatisfactory.
 Again, how do we measure success in this area?
It’s a matter of tracking some of the basic functions of journalism but doing it in a way that scales and takes into account the activity happening around us whether we have been seeking it out or not.
These would be some of the kinds of results that indicate we’re doing well in this area:
- We see important trends early, generally before the competition
- People with important information share it with us directly
- We are good at verifying information, recognizing it’s value and knowing what to do with it
- We are honest and fair in our assessments, and the market validates that view
- We are accurate and truthful by most objective standards
Measuring success with metrics
By isolating the activity happening in each area of the business in this way the metrics required to understand success and therefore to make decisions might look something like what’s below here.
And to be clear, these aren’t our metrics at the Guardian but rather a strawman for how one would think about applying real numbers against this strategy:
MAKE
- Time to develop, number of people involved
- Real cost of development
- Ease-of-use, performance and errors
- Aesthetic appeal
- Strengths against competition
- Weaknesses against competition
USE
- Number or amount of things produced
- Number of people using each thing
- Number of repeat uses
- Amount of time spent
- Breadth and depth of usage
- Supply vs capacity ratio
- Number of things purchased
- Amount received from buyers
- End-user response to promotions
- End-user conversion rate on promotions
- Amount received from advertising promotions
- Number of partners using our stuff in their stuff
- Revenue partners are earning from using our stuff
- Amount partners are spending to use our stuff
- Market share: end-users
- Market share: partners
SHARE
- Implicit interests collected from end-users
- Explicit interests collected from end-users
- Number of shares (tweets, RT’s, likes, mailto’s, etc.)
- Number of referral URLs posted
- Number of clicks from shares and referrals
- Number of comments within our stuff
- Number of comments elsewhere as a result of our stuff
- Quality of insights from comments
EVALUATE
- Number of articles/posts/pictures/video pitched to us
- Cost of acquiring articles/posts/pictures/video, etc.
- Amount of information intake
- Cost of data analysis on external inputs
- Success rate in surfacing strong signals in the data
- Low failure rate: verifying information
- Low failure rate: accuracy
When tracking performance indicators across all these areas, it becomes very easy to then understand what is going well and what isn’t.  Different metrics have different values in different contexts, but one could roll everything up into a framework that helps with decision-making.
For example, here are two imaginary products or features or story packages or any ‘things’ produced and measured using this approach compared back-to-back.
For the sake of argument, I’m contrasting a well-crafted digital product with modest commercial outcomes against an innovative but faulty experiment that inspires a lot of interesting activity.

Again, it would be a mistake to take this approach too literally, as it’s merely a tangible way to reflect the model I’m talking about here.
You can imagine the model working to both narrow the scope of what media businesses spend resources developing and also how the commercial model becomes a sort of fuel for making the ecosystem generative.
Products are then built to capture traditional revenue streams, but they also get built because they will have impact and create measurable and real value for the network.
Of course, stating that things must be built with the intent of creating value across a network is much easier said than done. Â We have to look toward some of the pioneers in this area to get a better idea of how to apply those concepts.
This series is an attempt to assemble some ideas I’ve been exploring for a while. Â Most of it is new, and some of it is from previous blog posts and recent-ish presentations. I’ve split the document up into a series of posts on the blog here, but it can also be downloaded in full as a PDF or viewed as a sort of ebook via Scribd:
